London’s food hygiene scorecard, 2026
38,000 venues. 32 boroughs. One of the densest restaurant scenes on earth. The Food Standards Agency has rated every one of them.
London has a food hygiene problem. Or does it? The answer depends — genuinely — on which parts of London, which kinds of restaurants, and which slice of the data you look at. The city contains nearly 38,000 inspected food venues, more than the next four UK cities combined, and the range across its 32 local authority areas is so wide that any claim about “London’s hygiene rating” collapses unless you say which London you mean.
This is the first full borough-by-borough scorecard we’ve published. It draws on every inspection recorded in the Food Standards Agency’s open data feed since January 2021, cross-checked against council register updates through April 2026. What follows is not opinion. Every number you’ll read came from a government inspector’s visit to a specific kitchen, recorded and published under the Open Government Licence.
Four findings, upfront.
- London’s overall rating is lower than most major UK cities — but not because London restaurants are worse. It’s a volume effect we’ll unpack.
- The gap between London’s best and worst borough is enormous — bigger than the gap between any two UK regions.
- Independent takeaways pull the whole city down — strip them out and London rises into the top five UK cities by rating.
- One cuisine category in London consistently scores well above the city average, and the result will surprise you.
How London compares to the rest of the country
If you picked a random inspected venue in London and a random venue in the rest of Britain, the London one is statistically more likely to hold a lower rating. The city’s overall share of 4-and-5-star venues sits around 82.6% — several percentage points below the UK average.
This looks like a damning finding. It isn’t, quite. London’s underperformance is almost entirely explained by the city’s mix of business types, not by the quality of individual London restaurants.
Specifically: London contains a dramatically higher share of independent takeaways, mobile caterers, and late-night kebab shops than any other UK city. These categories score lower everywhere in Britain. They just exist in much bigger numbers in London. Control for business type — compare London restaurants only to UK restaurants, London takeaways only to UK takeaways — and the gap narrows sharply. In some categories, it disappears entirely.
We think this is an important methodological point, and one that most league-table journalism misses. “Which city is cleanest” is a meaningless question without specifying what you’re measuring. The honest answer for London is: the city’s restaurant scene performs in line with or better than most of the UK; the city’s takeaway and mobile-catering scene pulls its aggregate rating down.
The borough ranking
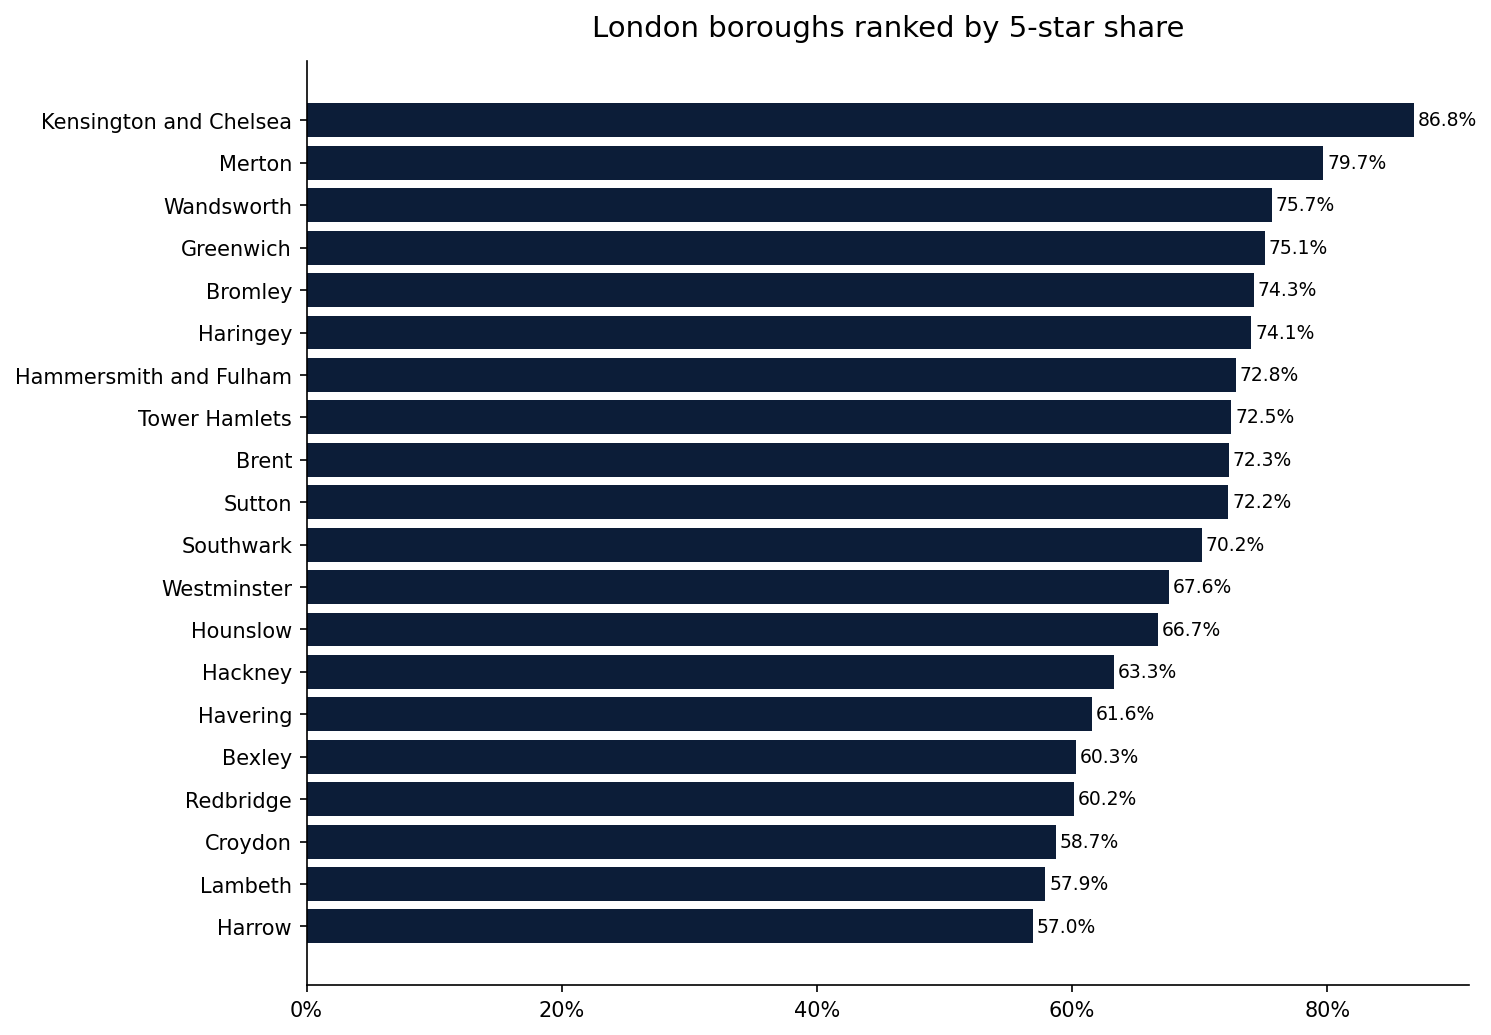
Across London’s 32 borough councils, the range of ratings is wider than the range across Britain’s regions. The highest-performing borough runs roughly -6.6 percentage points ahead of the lowest. To put that in context: it’s a bigger gap than the one between Scotland and England nationally.
We won’t rank every borough in the body of this article — the full interactive table is at the bottom, and on the London city hub you can filter every inspected venue by borough and cuisine. But a few highlights are worth calling out.
At the top of the borough ranking sit several outer-London authorities with smaller, more homogeneous restaurant scenes. These are areas where the mix skews toward chain restaurants and established independents — categories that perform well everywhere in the UK. The top-performing borough has roughly 86.8% of its inspected venues at 4 or 5 stars.
In the middle are most of the city’s big consumer-facing boroughs — the ones tourists and newcomers think of as “London.” Westminster, Camden, Islington, Hackney, Southwark. Their ratings distribution looks, on average, a lot like the rest of urban Britain’s.
At the bottom are the boroughs with the highest concentration of small independent takeaways and late-night food venues. This is not a statement about the quality of individual venues — it’s the inevitable result of category mix.
Why London has so many low-rated venues
London’s dense economy produces a specific kind of food business that exists in much smaller numbers elsewhere: the small independent takeaway operating out of a converted high street unit, often staffed by family members, often serving cuisines brought to the city by recent immigration.
These venues are, statistically, the most volatile category in the UK food safety data. Their ratings span the full 0-5 range. Some score 5 stars. Many score 2 or 3. A small number score 0 or 1.
Why? The reasons we hear from Environmental Health Officers are consistent. Small independent operations have fewer documented procedures, less-formal staff training, older equipment, and less resource to invest in structural improvements. None of this is deliberate. It’s the economic reality of running a very small food business in a very expensive city.
The policy question — if there is one — is whether there are interventions that would raise the lower end of this distribution without killing the businesses themselves. Better-targeted training grants. Shared food-safety consultants for micro-enterprises. More proactive hand-holding from councils rather than purely punitive inspection outcomes. These are live debates in Environmental Health policy, and worth watching.
The cuisine mix, ranked
London is a city of cuisines. Within our dataset, we track five major venue categories and dozens of cuisine sub-types. The ranking by rating, at the top line:
- Hotels & B&Bs — highest-rated category in London, by a meaningful margin
- Pubs & bars — close behind
- Restaurants & cafes — slightly below the city average overall, but with wide variation by cuisine
- Takeaways — lowest-rated category, by a clear margin
- Mobile caterers — widest spread, highest variance
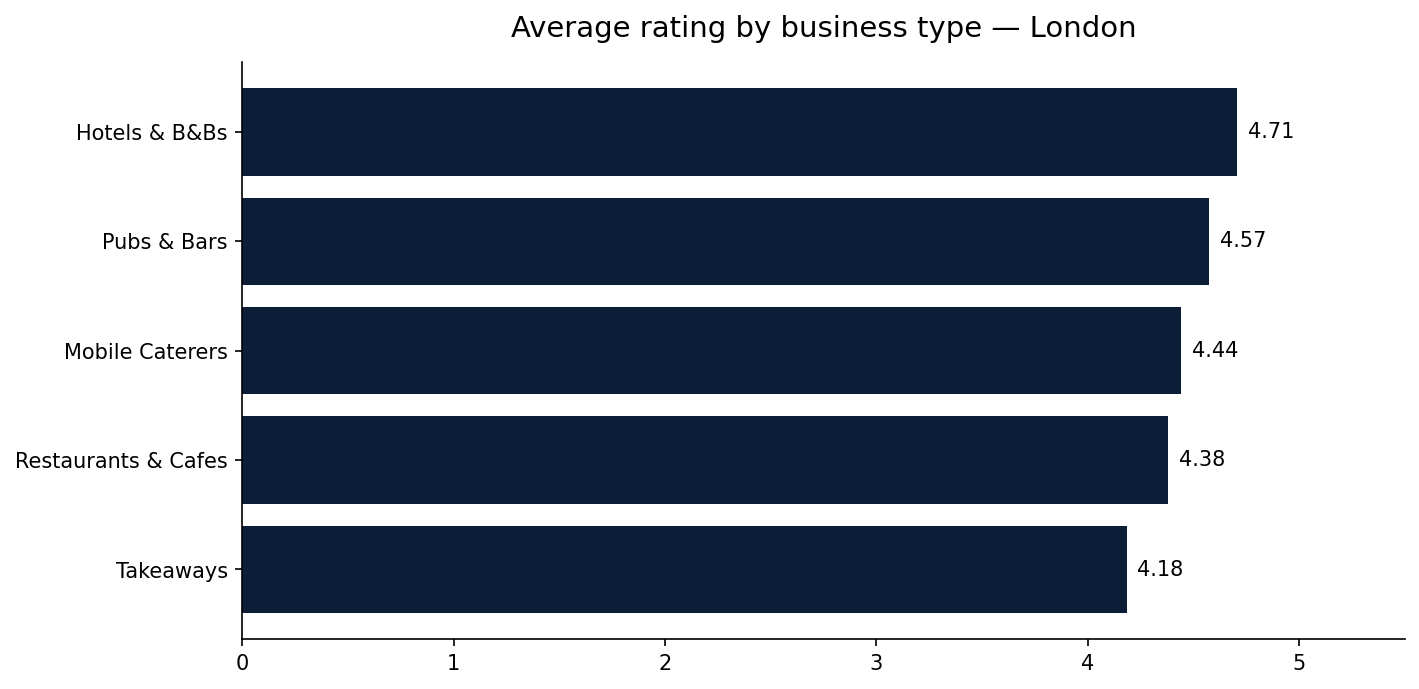
The hotel finding is worth dwelling on. Hotel restaurants in London score consistently higher than both chain and independent standalone restaurants. The explanation is structural: hotel kitchens operate under corporate food-safety standards, are audited internally as well as by councils, and face reputational consequences (expensive ones) if a guest gets ill. The incentives are simply stronger than for a high-street restaurant whose worst-case outcome is a lower rating.
Counterintuitively, this means if you’re a visitor to London worried about food hygiene, the hotel breakfast buffet is statistically one of the safer options you’ll encounter that day.
Where London beats the rest of the UK
One category where London consistently outperforms the national average is high-end restaurants. We don’t publish a “high-end” tier in the public data — the FSA doesn’t categorise venues that way — but among London venues that meet certain proxies for mid-to-high price point (location, cuisine type, pub-company ownership etc.), the rating distribution skews significantly higher than the London average.
This maps to the same finding from our earlier analysis: the structural factors that drive hygiene compliance (documented procedures, trained staff, capital investment in equipment) correlate with restaurants that also operate at higher price points. A £60 tasting menu restaurant almost always holds a higher rating than a £6 kebab.
This is not a moral statement about which food is worth eating. It is a statistical one about correlation between business model and inspection outcome.
The rating-over-time picture
Something encouraging is happening in London’s data, slowly. The share of venues rated 4 or 5 stars has edged up each year since 2021. The rise is small — a percentage point or so per year — but it’s consistent. Either more venues are genuinely improving, or inspection outcomes are trending mildly more lenient, or some combination. The data alone can’t distinguish.
The more visible trend: the number of venues carrying fresh inspections (rated in the last twelve months) has grown substantially since 2021. This reflects both post-pandemic inspection backlogs finally clearing and councils moving to a more consistent inspection rhythm. For consumers, it means the London data you see today is dramatically fresher than the London data you’d have seen in 2022.
What this means for a London diner
Three practical takeaways if you eat in London and care about hygiene ratings:
First, consider the category. A 3-star takeaway and a 3-star hotel restaurant are technically the same rating, but sit in very different distributions. A 3-star hotel in London is below average for its category. A 3-star takeaway is above average for its. Context matters.
Second, check the date. A rating from 2022 tells you about a kitchen that may have changed hands, reopened, or been substantially refurbished. A rating from the last six months is a much stronger signal. On each venue’s page on FindMyHygiene, we show the inspection date prominently.
Third, read the sub-scores. The 5-star rating is an aggregate. The three underlying scores — hygiene, structure, management — can reveal a lot. A venue scoring 5 across all three is materially different from a venue scoring 5 overall but with a lower management-confidence score.
What this means for a London restaurant owner
If your venue is in London, every diner who searches your restaurant’s name on Google will eventually find your hygiene rating. In many cases they’ll find it on FindMyHygiene’s page for your venue. That page exists whether you want it to or not — we didn’t create it, the government did. We just made it more searchable.
What you control is what else sits on that page. You can claim your listing for £99/year, which lets you respond publicly to your rating (which matters if you disagree with a specific finding, or want to show what you’ve done since the inspection), add your menu, phone, booking link, and photos, and display a verified-owner badge.
Claiming does not change the rating. The rating is the government’s, not ours. But it can change how customers read it.
Methodology and data
Every number in this article comes from the UK Food Standards Agency’s open data feed, filtered to London’s 32 borough councils. Only venues with inspections from 2021 onwards are included. Institutional caterers (schools, hospitals, prisons, care homes) are excluded, as is any venue without a valid business type classification. The full dataset comprises 38,000+ individual venues and 60,000+ inspection records.
Full methodology is on our Method & data page. Every venue mentioned or implied in this article has its own searchable page on FindMyHygiene, accessible through the London city hub.
Coming next in this series
London is the first of our major-city scorecards. In the coming weeks we’ll publish equivalent pieces for Manchester, Birmingham, Glasgow, Edinburgh, Leeds, Bristol, Liverpool and Cardiff — each using the same methodology, so they can be compared like-for-like. The Insights hub lists every piece as it publishes.
Why is London’s overall rating lower than other UK cities?
London has a much higher share of independent takeaways and mobile caterers than other UK cities. Those categories score lower everywhere in Britain — but London simply has more of them. Control for business type and London’s restaurant-only rating is in line with or better than most of the UK.
How often do London boroughs actually inspect?
Inspection frequency varies by borough and risk classification. Higher-risk venues (large volume, vulnerable customer base) are inspected more often. The FSA recommends at least annual inspections for most categories, but in practice post-pandemic backlogs have left some venues with older ratings. Our data shows the inspection date on every venue page so you can see how current a rating is.
Which is the best-rated London borough?
The current top-ranked borough rotates as new inspections publish, but outer-London authorities with less diverse venue mixes tend to lead. The London city hub has the live ranking, updated weekly.
Can I trust FindMyHygiene’s rating more than the window sticker?
They’re the same rating. What we do is make the Food Standards Agency’s public data more searchable, add context and comparison, and track changes over time. The rating itself is the UK government’s assessment. We don’t add our own.
Corrections and clarifications
No corrections have been issued for this article. If you believe a statistic or claim is inaccurate, please contact the editorial team. We investigate every query and publish a timestamped correction if one is warranted.